
Why Most Backtests Are More Fragile Than They Look
Part 1/3

You do not need to understand any of this article to follow and be a member of the Retirement Portfolio. The portfolio remains deliberately very simple: a small number of ETF trades, once a month, that’s it, done.
This article (part of a three-part series) is optional reading for those members who want to further understand some of the thought and research behind the scenes. Part 1 will be an introduction to the pitfalls of backtests, part 2 will show what happened when I tried to break the Retirement Portfolio and finally, in part 3, we cover what the testing actually showed us, what held up, why that matters and what the results add to the case for trusting the Retirement Portfolio.
A backtest can never prove that an investment strategy will work in the future but there are ways to make it more credible. This is known as robustness testing and in practical terms, it’s when we try to find out whether the backtest results still hold when we change things around. A few examples would include things like the lookback period, the ETFs used, the assumed trading prices and the market period being tested.
A thorough backtester must therefore effectively interrogate and probe the system relentlessly from all angles and see whether and where it breaks. A strategy that only works under one very precise set of conditions deserves very little credit, but a strategy whose broad behaviour survives reasonable changes in all of those things deserves more attention.
Parts 2 and 3 will be available to paid subscribers only. Part 1 is free for everyone because the concepts here apply to any investment strategy, not just this one.
Why good backtests can still fool us
Investment research has a basic problem right now which is that it’s remarkably easy to build a backtest that looks excellent in hindsight. We can change a lookback period, an ETF, a rebalance date, add a trend filter and so on, and eventually if we try enough combinations something impressive appears. The resulting equity curve may look scientific while actually containing enormous amounts of hidden problems. Readers see only the one strategy that made it through. They don't see the hundreds of decisions and rejected variants behind it. So when evaluating any backtest, the first question should never simply be:
“How good was the backtest?”
Rather:
“Did the idea really work, or did we just keep changing it until the backtest looked good?”
When a backtester has produced a system with these flaws we would describe it as being ‘overfitted’. Overfitting sounds complicated, but the basic problem is pretty simple. You keep tweaking a system until it gets very good at explaining what already happened. Unfortunately, the future may behave very differently from the historical pattern we just optimised for.
In investing, this does not necessarily require machine learning or complicated mathematics, even a simple trading rule can be badly overfit. Let’s say 12-month momentum works, testing 11 and 13 months is also reasonable, but testing every value between 1 and 36 and selecting 17 because it alone had the highest CAGR is a different matter altogether. The important question is why we picked that setting in the first place. Was there a sensible reason for using it, or did we just keep testing different numbers until it produced the best result? The latter massively increases the danger that the chosen result is partly statistical noise and overfitted.
Too many choices, too much freedom
An inexperienced backtest engineer may not overfit deliberately or even know that they have overfitted. They rarely sit down intending to do it, but instead complexity creeps into the research process and before long they’re deciding which ETFs count, which lookback to use, when exactly to rebalance, what price trades are assumed to occur at, whether cash earns interest... and so on, and suddenly they've got an awful lot of knobs to turn.
Each decision may appear individually reasonable but the list goes on and on, creating what statisticians sometimes describe as researcher degrees of freedom. That is, the more choices available to the researcher, the easier it becomes to stumble across something attractive.
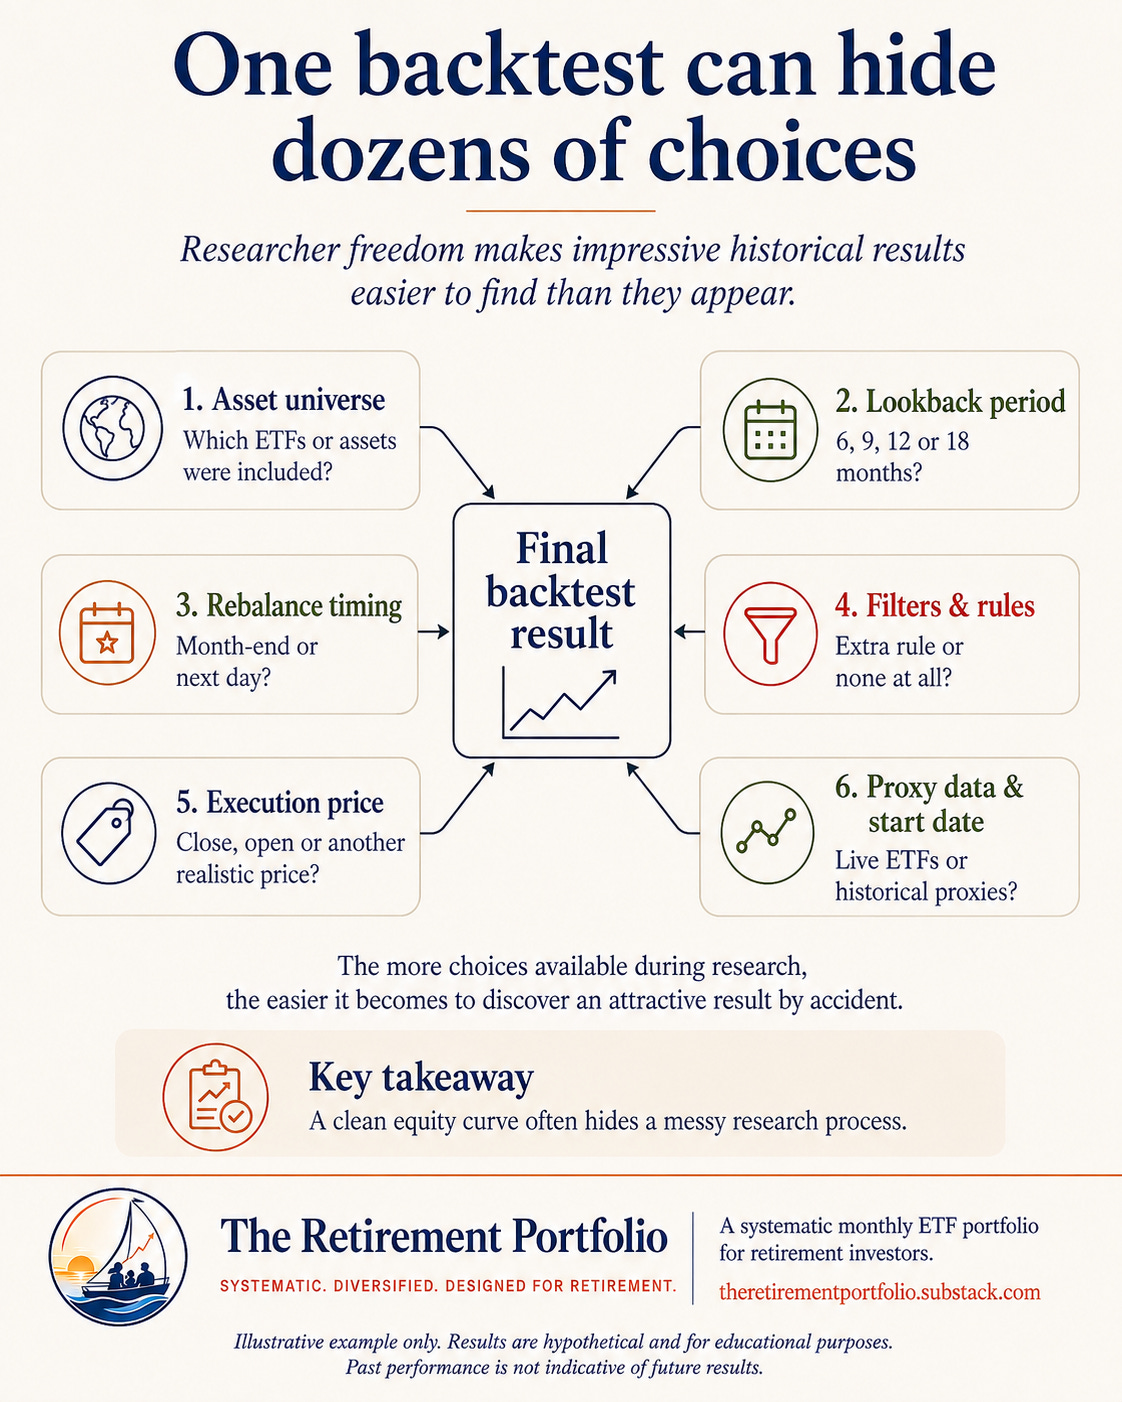
Every additional rule gives a strategy another opportunity to fit historical noise but that does not mean all complexity is bad. Sometimes complexity reflects genuine market structure but complexity should have to earn its place. A useful question is:
If I remove this rule, does the fundamental behaviour disappear?
If removing one obscure condition causes performance to collapse, that condition deserves scrutiny. A robust strategy should usually derive most of its behaviour from a relatively small number of big ideas doing the heavy lifting.
Parameter robustness: peaks vs plateaus
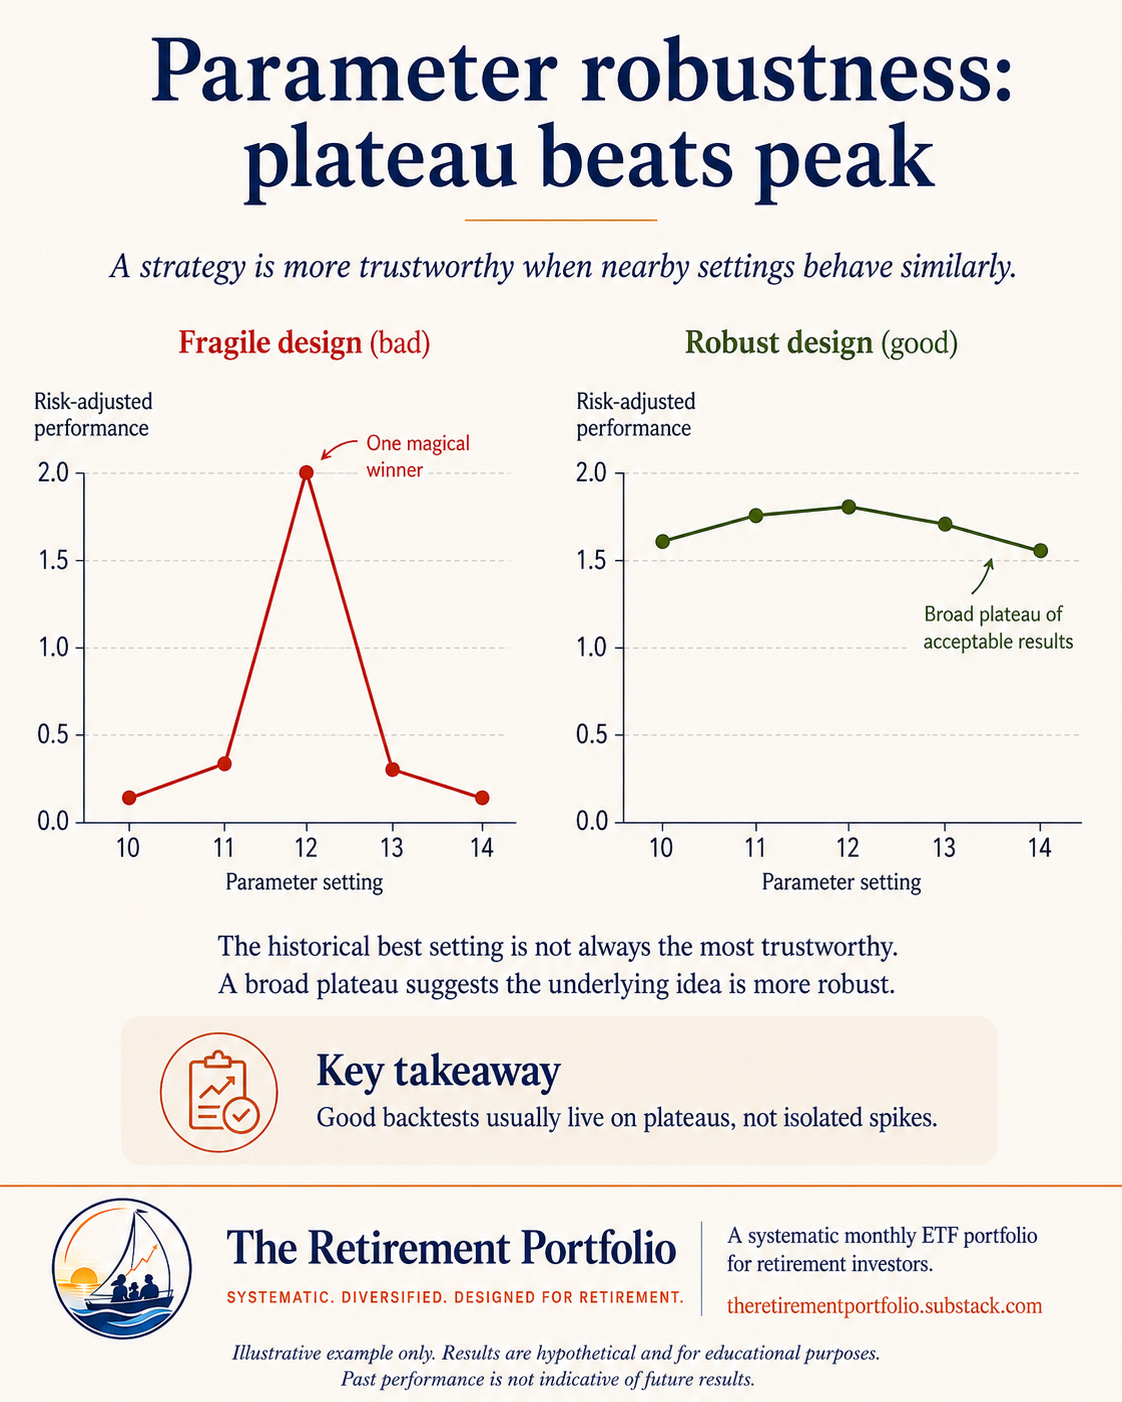
This is one of the most important concepts in the entire investigation. Let’s look at an example: imagine testing momentum lookbacks from 6 to 18 months and finding that there are two different possible outcomes.
In the first one: 10 months is poor, 11 months is poor, 12 months is extraordinary, 13 months is poor, and 14 months is terrible. That is a performance spike and it should make us a bit nervous.
In the second: months 10, 11, 12, 13 and 14 all work reasonably well. Twelve months happens to be slightly better, but it lies inside a broad plateau of acceptable results (see image below). That is much stronger evidence. We should therefore care less about whether a system’s exact production parameters are optimal and considerably more about whether nearby sensible parameters still produce acceptable behaviour.
The optimisation paradox
Bearing in mind some of the issues we have raised above we are presented with somewhat of a strange paradox in systematic investing, which is that the best-looking backtest is often not the strategy we should want to own.
Suppose one configuration produces: 20% CAGR with a 15% maximum drawdown but several alternatives yield 14–16% CAGR with 12–14% drawdowns. The temptation is obviously to choose the first option but if that is an isolated historical optimum while the other alternatives cluster around the second result, then the apparently inferior systems may actually be more robust and the superior choice. So the aim should not always be just to find the highest backtest CAGR but to find a defensible region of the parameter space where the underlying behaviour persists. This is potentially a fatal error and unfortunately it isn’t confined to just beginners. I’ve seen experienced investors and established investment platforms fall into exactly the same trap, chasing the highest historical CAGR rather than asking whether the result is actually robust.
Why an economic rationale matters
A good backtest is useful, but I’m much more comfortable with a strategy if I can also understand why it might work in the first place. Momentum is a good example as there is a reasonable behavioural argument for why trends can persist. Markets are made up of people and institutions, and they do not always react to new information instantly or perfectly. Prices can initially underreact to news, while information itself may take time to spread through the market.
As investors we know this already but it’s good to see the academic literature aligns too. Hong, Lim and Stein (2000) found evidence consistent with information spreading gradually through markets, particularly where stocks had less analyst coverage.¹ Barberis, Shleifer and Vishny (1998) also developed a behavioural model showing how investors can underreact to new information and then overreact as a run of similar news develops.² More importantly, this is still being investigated rather than being an idea left behind in the 1990s. A 2025 international study by Goyal, Jegadeesh and Subrahmanyam examined momentum across a wide range of markets and found evidence supporting limited attention and underreaction as important contributors to the effect.³ However, none of this means momentum is guaranteed to keep working and it certainly doesn’t mean every momentum strategy will work either. We have to therefore check in on models and markets from time-to-time, and I myself always do an annual review in January.
For me though, the point is that I would rather build around an investment effect that has both a substantial body of empirical evidence and a plausible reason for existing than rely on some obscure rule that just happens to make a historical backtest look fantastic. If the only explanation for a strategy is “because Python said it worked”, I’m immediately more suspicious.
The same principle applies to the other ideas behind the portfolio: things like diversification and risk management also have a rationale. Neither guarantees a good outcome, but at least we have something more substantial underneath the strategy than a pretty historical equity curve.
So what am I actually looking for?
In summary, the main lesson is probably quite simple. A backtest should not impress us just because it looks good. What matters more is whether the result survives when we start making life difficult for it, disrupt it, change parameters, dates, assumptions, markets and so on. If the whole thing falls apart immediately, then the original result probably deserved less confidence than it first appeared to. That is really what robustness testing is about. It is not about proving that a strategy will work in the future. We cannot do that.
It is about trying to reduce the number of ways in which we may have fooled ourselves.
Personally I would much rather own a strategy with a slightly less spectacular historical result that survives a broad range of sensible tests than one with a beautiful backtest that only works under one very precise set of conditions. This then brings us to the obvious next question. How well does the Retirement Portfolio itself stand up to this kind of treatment?
That is what I’m going to look at next.
In Part Two I’ll turn the same scrutiny on the actual Retirement Portfolio, I will change parameters, periods, markets and execution assumptions to show you what survives. It’s easy to publish a great-looking backtest but it’s much less comfortable to start looking for reasons it might be wrong. Long-term trust comes from being willing to test it properly.
References
Hong, H., Lim, T. & Stein, J.C. (2000), Bad News Travels Slowly: Size, Analyst Coverage and the Profitability of Momentum Strategies, Journal of Finance, 55(1), 265–295.
Barberis, N., Shleifer, A. & Vishny, R. (1998), A Model of Investor Sentiment, Journal of Financial Economics, 49(3), 307–343.
Goyal, A., Jegadeesh, N. & Subrahmanyam, A. (2025), Empirical Determinants of Momentum: A Perspective Using International Data, Review of Finance, 29(1), 241–273.