
Performance Update: July 2026

Welcome to the monthly performance update for The Retirement Portfolio - the systematic ETF strategy I use to manage my own personal funds.
Each month I’ll publish the latest performance figures, put the most recent month into context, and look at how the strategy is progressing.
The performance updates will remain open to everyone. The current ETF selections, portfolio changes and monthly trading signals are reserved for paid subscribers.
New to The Retirement Portfolio?
It’s a systematic approach to retirement investing that prioritises drawdown control over raw returns - while still delivering around 15% CAGR with a max daily drawdown of -12.3%.
🧭 More about the Retirement Portfolio
🛡️ The Retirement Portfolio ETF strategy
📖 The Long Road to Systematic Investing
July 2026 at a Glance
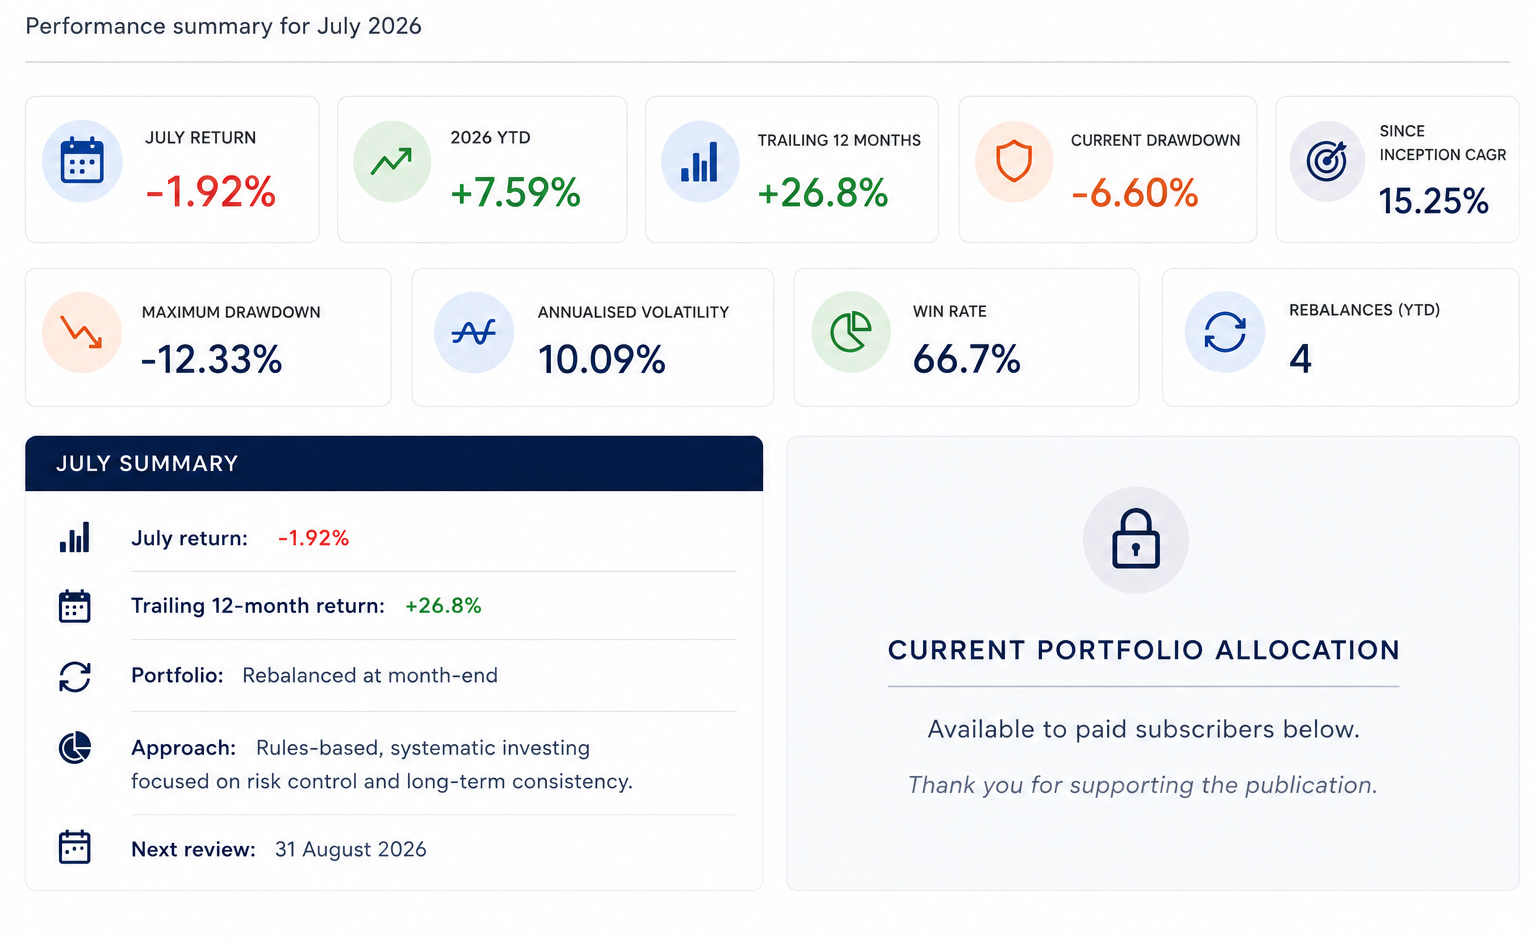
July was another relatively quiet month for the Retirement Portfolio, finishing -1.92% and that left the portfolio +7.59% for 2026 so far. August has started positively too, with the portfolio up +1.22% month-to-date at the time of writing.
One month tells us very little about whether an investment strategy is working though. I include the monthly numbers because I want the performance record to be transparent, but I’m far more interested in what happens over longer periods, and in how much risk was required to achieve those returns. For a retirement portfolio in particular, that second part matters a great deal.
The Bigger Picture
The last 12 months give a much more useful perspective than July on its own and in that respect, over the 12 months to the end of July, the Retirement Portfolio returned +26.8%.
That's a strong result, but return on its own isn't really the number I'm trying to optimise. For someone still accumulating investments, a large market fall can be uncomfortable. But if you are already drawing money from a portfolio, it can be much more serious. Selling investments after a large decline can permanently damage the amount of capital left to participate in the eventual recovery. That’s why I’ve always been particularly interested in the relationship between return and drawdown.
Across the historical backtest and subsequent live period since July 2015, the numbers look like this:
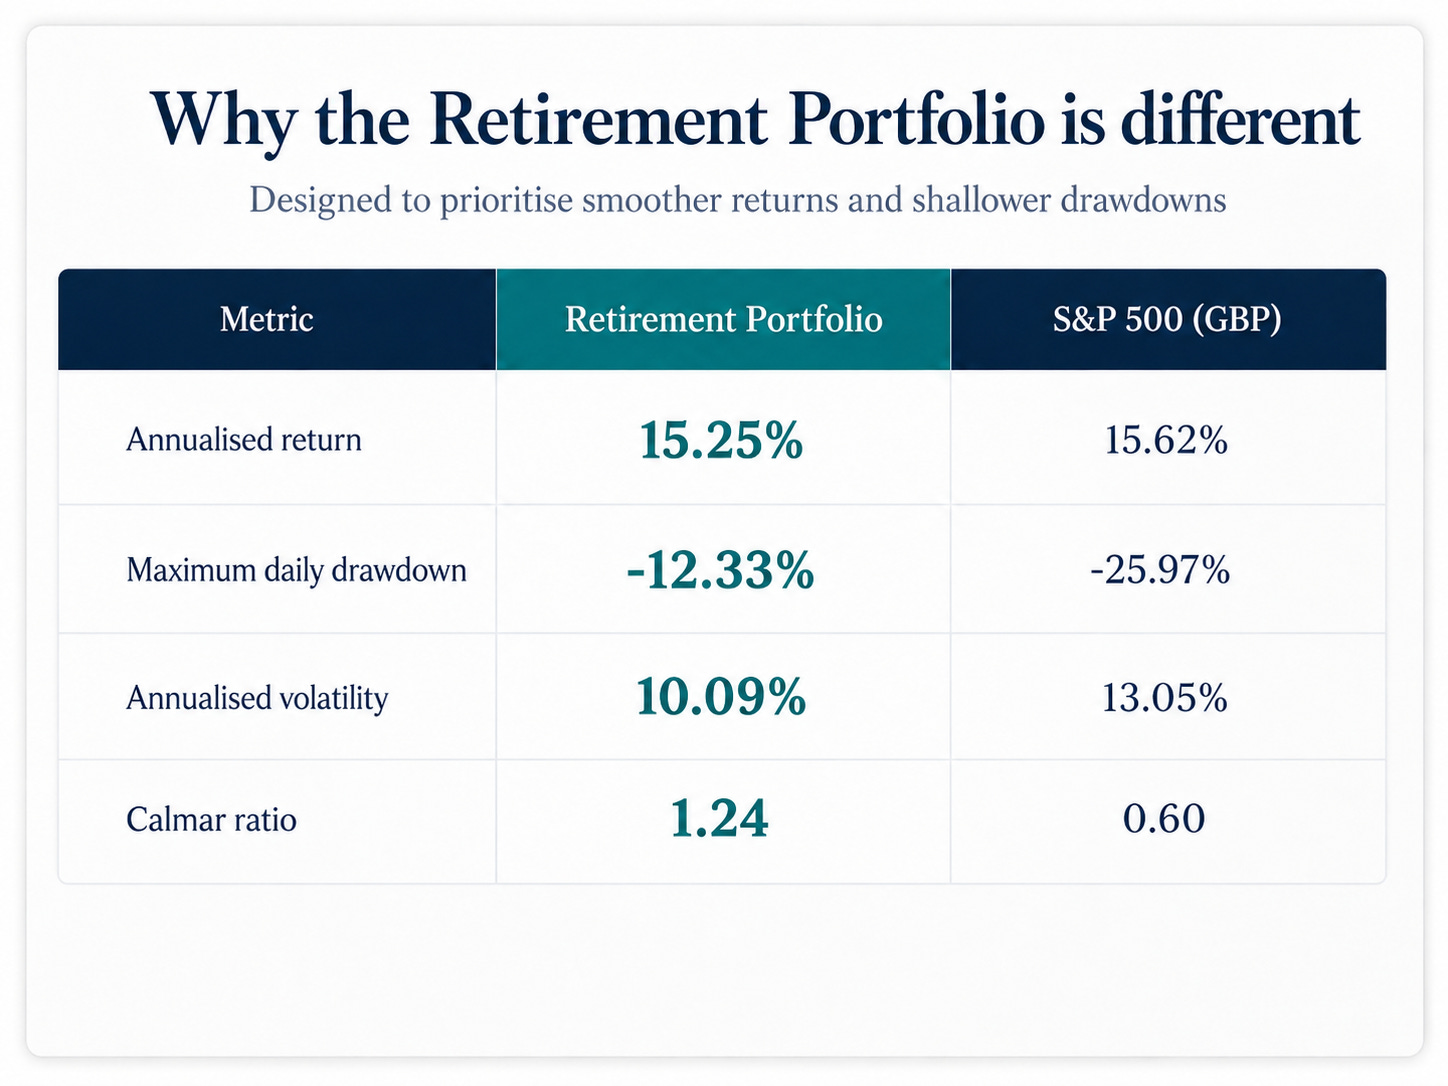
The S&P 500 has been an exceptional investment over this period. In fact, measured in GBP, it has produced a very slightly higher annualised return than the Retirement Portfolio. But it has also experienced a maximum drawdown of almost 26%, compared with approximately 12% for the Retirement Portfolio. That’s the trade-off I’m interested in.
I’m not trying to build a portfolio that beats the stock market every month, and I’m not trying to squeeze out every possible percentage point of return regardless of the journey required to get there. My aim is to capture attractive long-term returns while keeping the inevitable declines at a level I can realistically tolerate while living from the portfolio.
As an example, a 25% fall means £300,000 becoming roughly £225,000 before any withdrawals are taken. A 12% fall would still leave around £264,000. Both are unpleasant, but they represent very different retirement experiences, and that difference becomes particularly important when withdrawals are happening at the same time as markets are falling.
For me, that’s what the Retirement Portfolio is really designed around: not avoiding losses altogether, but trying to avoid the sort of losses that can derail a retirement plan.
Why I Don't Rely on the US Alone
Another thing worth considering is how heavily many ETF strategies depend on the US market. It’s easy to understand why as US equities have produced exceptional returns for a long time, and recently it has often seemed as though owning anything else has simply diluted performance. History is a useful reminder that this hasn’t always been the case.
The chart below, from Charlie Bilello at Creative Planning, shows that the US market has experienced some extraordinarily long periods between new highs. Following the 1929 crash, for example, the S&P 500 price index went roughly 23 years before reaching another record. The period surrounding the dot-com crash and Global Financial Crisis also produced a long stretch in which new highs were extremely scarce.
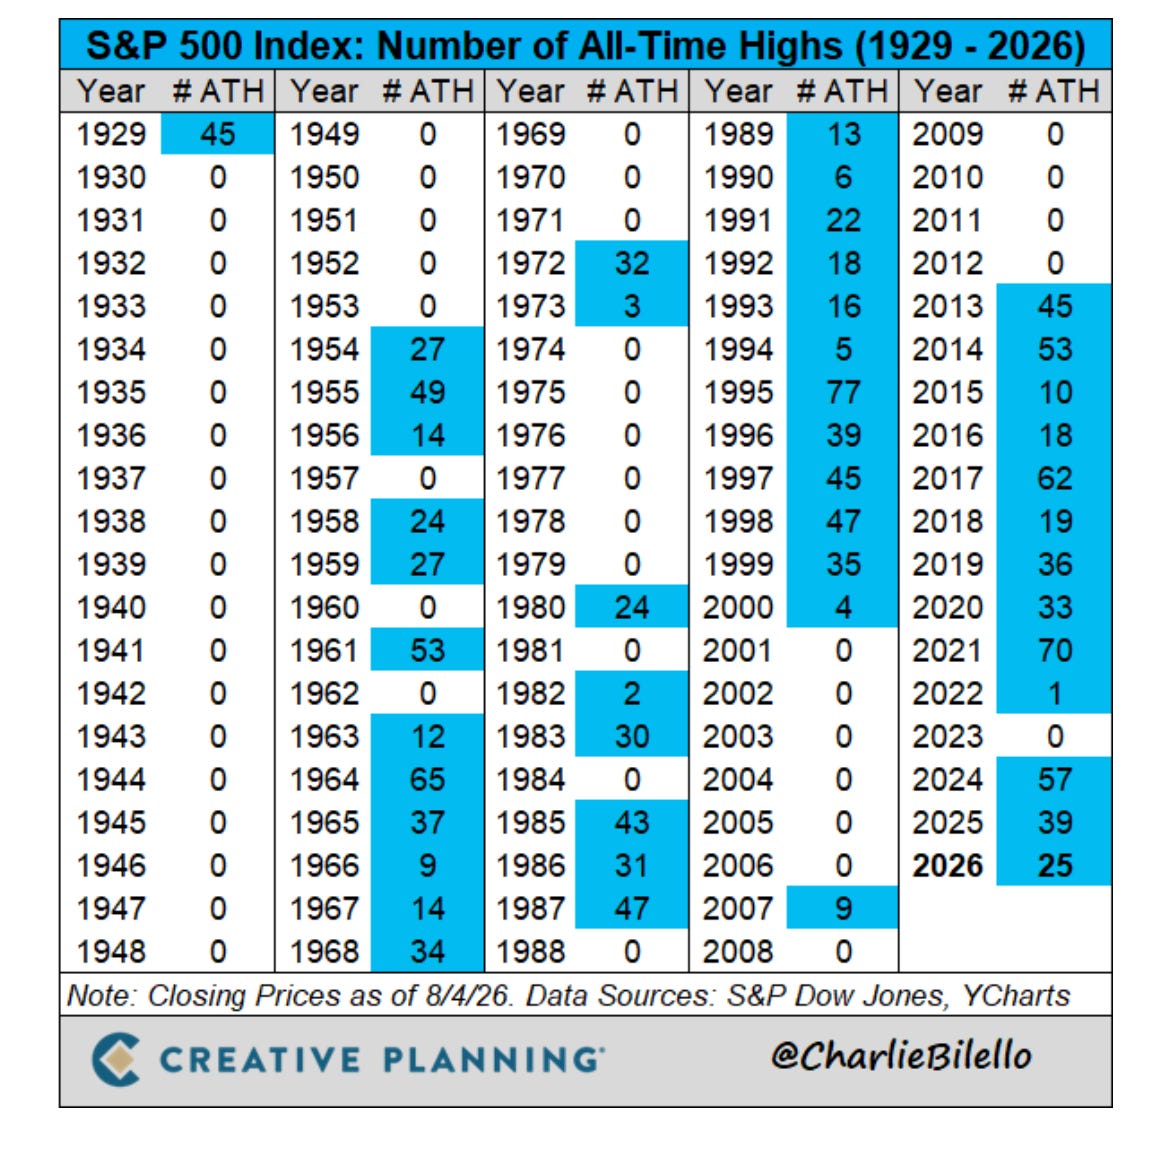
This isn’t an argument against investing in the US, far from it. The Retirement Portfolio contains plenty of US exposure and will happily hold it when the system favours it. However, I don’t want my retirement to depend on one country continuing to lead indefinitely. That’s one reason the strategy also has access to markets outside the US. If market leadership changes in the future, the system has the opportunity to move with it rather than being structurally tied to yesterday’s winner.
2026 So Far
The individual monthly returns for the Retirement Portfolio have been:
January: +5.92%
February: +8.75%
March: -8.03%
April: +0.94%
May: +4.68%
June: -2.01%
July: -1.92%
2026 YTD: +7.59%
It’s quite a useful sequence. If you had looked at the portfolio at the end of February, the year had started extraordinarily strongly. One month later, much of that gain had disappeared. And despite a fairly unremarkable period since then, the strategy remains comfortably positive for the year. It’s another reminder of why extrapolating from a few weeks or even a few months of performance is rarely useful.
One Month Doesn’t Change the Strategy
I like publishing the monthly figures because they create a genuine record of what happens after a strategy leaves the backtest and starts being followed in real time but I don’t want these updates to become a monthly exercise in judging whether the strategy has suddenly become good or bad. A positive month doesn’t validate it and a negative month doesn’t invalidate it. What matters is how it behaves across different market environments over many years. For me, the questions are much more straightforward:
- Is the strategy continuing to behave broadly as expected?
- Are the drawdowns remaining manageable?
- Are the rules still being followed consistently?
- And is the portfolio continuing to compound over the longer term?
So far, the answer to those questions remains yes!
What Is the Portfolio Holding Now?
This is where I’ve deliberately separated the free and paid parts of the publication. I’ll continue publishing the performance of the Retirement Portfolio openly, so anyone following the publication can see how it is actually doing, but the current holdings, target weights, portfolio changes and month-end trading signals are different. Those are the practical instructions required to actually follow the strategy, so they are reserved for paid subscribers.
The latest month-end review has already been completed and the August portfolio signal is now available.
That post includes the latest ETF selections, target allocations and any changes required following the July month-end review.
If you’re already a paid subscriber, there’s nothing additional you need to do from this performance update - the actionable information is all in that signal post.
A Note for US Investors
The performance figures in this update relate to the original GBP implementation of the Retirement Portfolio.
US members now have a dedicated USD implementation of the strategy using US-listed ETFs. The underlying framework is the same, but the US version includes an additional trend filter on the attack side, so there may occasionally be differences in holdings between the two implementations.
At the end of July, the US implementation stood at +12.0% for 2026 YTD and +35.6% over the trailing 12 months.
Going forward, each monthly signal post will include a separate US investors section with the relevant US-listed ETFs and target weights.
Why Your Returns May Be Slightly Different
Just a little note here on something a few investors always ask about. Even when two investors are following the same strategy, their realised returns won’t necessarily match mine to the decimal point. There are several perfectly normal reasons for that.
- The exact price obtained when buying or selling an ETF will vary.
- Platforms have different dealing costs and spreads.
- Investors outside the UK may follow a separate implementation using ETFs listed in their home market.
- Currency movements can also affect returns depending on the investor’s home currency.
For that reason, the figures published here should be viewed as the performance record of the Retirement Portfolio model, rather than a promise that every subscriber will reproduce every monthly result exactly. Small implementation differences are unavoidable.
Some of these small positive and negative differences may wash out over time, although they won't necessarily disappear completely. In my robustness testing I have also looked at different ETF implementations, markets and time periods, including a dedicated USD implementation for US investors. The results have remained consistent with the broader objective of the strategy - attractive long-term returns while keeping drawdowns at a level that is more manageable for a retirement portfolio.
Final Thoughts
July wasn’t spectacular. It didn’t need to be. A retirement strategy doesn’t need every month to make money, and it certainly doesn’t need every month to beat the stock market. What matters to me is what happens over the longer term and what I have to endure along the way.
At the end of July, the Retirement Portfolio stands at:
+7.59% in 2026
and
+26.8% over the trailing 12 months.
The historical maximum daily drawdown remains around -12.33%. Those are the numbers I’ll continue watching. The next formal signal will be taken at the end of August, with any required portfolio changes implemented at the start of September.
Until then, there is nothing for me to predict and nothing for me to fiddle with. The rules remain in control. The system is very robust.
Thanks for reading and enjoy your summer!

Performance Notes: performance figures are shown in GBP and represent the Retirement Portfolio model. Historical results prior to the live publication of the strategy include backtested/modelled performance and should not be interpreted as returns achieved by subscribers or as the live track record of an investment fund. Actual investor returns may differ because of ETF selection, execution prices, bid/offer spreads, platform fees, taxes and currency movements.
Disclaimer: The Retirement Portfolio is published for educational and informational purposes only. Nothing published here constitutes personal financial advice or a recommendation to buy or sell any security. Investing involves risk. The value of investments can fall as well as rise and you may get back less than you invest. Historical, simulated and backtested performance is not a reliable indicator of future performance. There is no guarantee that the Retirement Portfolio will reproduce its historical results in the future. The information published here does not take into account your personal financial circumstances, investment objectives or tolerance for risk. Any investment decisions you make remain your own responsibility. Where appropriate, you should seek advice from a suitably qualified financial adviser.